You can wear the most advanced Garmin on the market, log every session perfectly, and still end up flat, injured, or burned out. That disconnect is frustrating, especially for athletes who train consistently and believe data should protect them from obvious mistakes. The reality is that overtraining rarely comes from doing something obviously reckless; it comes from stacking slightly too much stress for slightly too long without realizing it.
Most Garmin users understand individual workouts well. Pace, power, heart rate, Training Effect, and even VO2 max trends all feel intuitive in isolation. Where things break down is at the cumulative level, where your body doesn’t respond to a single hard session, but to weeks of load layered on top of imperfect recovery.
This is the gap Garmin’s Chronic Load and Load Ratio metrics are designed to fill. They exist to answer a question that no single workout screen can: how much stress your body has absorbed recently, how prepared it is to handle more, and when “productive” quietly turns into “too much.”
The false sense of security created by workout-level metrics
Smartwatches excel at evaluating sessions, not seasons. You finish a hard run and see a Productive Training Effect, your pace was solid, heart rate stayed controlled, and recovery time looks manageable. Individually, nothing looks wrong.
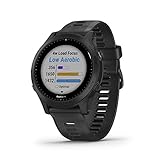
🏆 #1 Best Overall

- Premium GPS running/triathlon smartwatch with music
- Battery life: Up to 2 weeks in smartwatch mode, 10 hours in GPS mode with music or up to 60 hours in ultratrac mode.
- Performance monitoring features include Vo2 Max and training status with adjustments for heat, altitude Acclimation status, training load focus, recovery time, and aerobic and anaerobic training effects
- Garmin Pay contactless payment solution (available for supported cards from participating banks) lets you make convenient payments with your watch so you can leave your cash and cards at home
- Full color, onboard maps guide you on your run so you never get lost during your workout
The problem is that the watch does not flag risk when stress accumulates gradually. Five or six “good” workouts in a row can still overload connective tissue, the nervous system, or endocrine recovery if the total load keeps climbing faster than your body can adapt.
This is why experienced athletes often say they felt great right up until they didn’t. Overtraining rarely announces itself with one bad workout; it sneaks in through consistency without context.
Why listening to your body alone is no longer enough
Garmin users are typically disciplined, motivated, and goal-oriented, which makes them especially vulnerable to ignoring subtle warning signs. Mild fatigue, slightly elevated resting heart rate, or poor sleep are easy to rationalize when the training plan looks good on paper.
Subjective feel is also unreliable during high motivation phases. When fitness is rising, adrenaline and confidence can mask mounting physiological stress, particularly in endurance athletes and CrossFit-style high-intensity trainers.
Garmin’s load metrics attempt to quantify what you can’t feel accurately day to day: how much strain your system is carrying beneath the surface.
The mismatch between effort, recovery, and adaptation
Training only works when stress and recovery stay in balance long enough for adaptation to occur. If stress increases faster than recovery capacity, performance eventually stalls or regresses, even if effort remains high.
This imbalance is especially common during mileage build phases, race-specific intensity blocks, or when life stress reduces sleep and nutrition quality. Your watch may still show solid paces and power outputs, but your body is quietly falling behind the demands placed on it.
Chronic Load captures this longer-term accumulation, while Load Ratio highlights when short-term stress spikes beyond what your recent training history supports.
Why overtraining still happens with “smart” guidance
Garmin’s daily suggested workouts, recovery timers, and Training Status are helpful, but they are intentionally conservative and generalized. They are designed to work for millions of users, not your specific injury history, work stress, or background volume tolerance.
Without understanding Chronic Load and Load Ratio, athletes often override suggestions because they feel capable in the moment. The watch isn’t wrong; it’s incomplete unless you know how to read the deeper context it provides.
These metrics are not there to slow you down unnecessarily. They exist to keep progress sustainable by flagging when your current trajectory is more likely to end in breakdown than breakthrough.
The problem Garmin’s load system is trying to solve
At its core, Garmin’s load framework is an attempt to model training stress the way a coach would over months, not workouts. Chronic Load reflects what your body is accustomed to handling, while Acute Load represents what you’ve asked it to absorb recently.
Load Ratio compares the two, acting as an early warning system when short-term ambition outpaces long-term preparation. When used correctly, this combination shifts decision-making from emotional and reactive to strategic and preventative.
Understanding this system is the difference between using a Garmin as a recording device and using it as a training management tool. The sections that follow will break down exactly what these numbers mean, what ranges actually matter, and how to apply them in real training decisions without becoming a slave to the data.
What Garmin Training Load Actually Measures (and Why It’s Not Just ‘Hard Work’)
To make sense of Chronic Load and Load Ratio, you first need to understand what Garmin means by Training Load itself. This is not a simple tally of miles, hours, or calories, and it’s not a judgment of how tough a workout felt in the moment.
Garmin Training Load is an estimate of physiological stress, modeled to reflect how much a session disrupted your internal equilibrium and therefore how much recovery it demands. Two workouts can look similar on paper and produce very different load values if they stress your body in different ways.
The physiological backbone: EPOC, not effort
At the core of Garmin’s Training Load is excess post-exercise oxygen consumption, or EPOC. This is a well-established sports science concept describing how much extra oxygen your body needs after exercise to return to baseline.
Higher EPOC means greater disruption to homeostasis, which usually correlates with more recovery time and greater adaptive stimulus. Garmin estimates EPOC using heart rate behavior relative to your known or estimated VO2 max, not just raw heart rate or pace.
This is why a short, hard interval session can generate more load than a longer easy workout. The stress comes from how far you push your aerobic and anaerobic systems away from normal, not how long you were uncomfortable.
Why intensity distribution matters more than volume
Garmin splits Training Load into aerobic low, aerobic high, and anaerobic components. This breakdown is critical, because not all stress accumulates or recovers in the same way.
Low aerobic load builds durability and efficiency with relatively low recovery cost. High aerobic and anaerobic loads drive performance gains, but they carry a disproportionate recovery and injury risk if stacked too aggressively.
Chronic Load aggregates all of this, but Load Ratio is especially sensitive to sudden increases in high-intensity stress. That’s why athletes often run into trouble after adding “just one more” hard session to an otherwise stable week.
Why Training Load is not a proxy for toughness
A common mistake is treating Training Load as a badge of honor, where higher is automatically better. In reality, load is a cost, not a reward.
Garmin does not know if a workout was brave, gritty, or mentally satisfying. It only models how much strain your cardiovascular system absorbed and how long it will likely take to recover from it.
This distinction matters because athletes can feel strong while quietly accumulating unsustainable load. When motivation, caffeine, or group dynamics mask fatigue, Training Load often tells a more honest story than perceived exertion.
Device accuracy and why consistency matters
Training Load is only as good as the data feeding it, particularly heart rate. Optical heart rate sensors on the wrist are generally reliable for steady-state efforts but can lag or spike during intervals, strength training, or cold-weather sessions.
Using a chest strap for hard workouts improves load accuracy, especially for anaerobic work that heavily influences Acute Load and Load Ratio. Consistency also matters more than perfection; using the same device, fit, and sensor type keeps trends meaningful even if absolute values are not flawless.
Battery life and comfort play a role here as well. A watch that dies mid-session or is uncomfortable enough to loosen during training introduces noise into the data, which can quietly distort load calculations over time.
How Training Load feeds Chronic Load and Load Ratio
Every recorded activity contributes a discrete Training Load score. Acute Load sums these scores over roughly the last seven days, while Chronic Load reflects a longer rolling window that represents what your body has recently adapted to.
Load Ratio simply compares the two, highlighting when recent stress is significantly higher than your established baseline. This is why understanding what Training Load actually measures is non-negotiable; if the inputs are misunderstood, the warning signs are easy to dismiss.
When athletes say Garmin is “too cautious,” it’s often because they’re equating hard work with productive stress. The load system is not anti-effort, but it is unforgiving of intensity piled on faster than adaptation can keep up.
What this means for real-world training decisions
If a workout spikes your Training Load far more than expected, that’s a signal to look beyond pace or power. Heat, poor sleep, illness, travel stress, or accumulated fatigue can all inflate physiological cost without obvious performance decline.
Over time, Chronic Load tells you what your body considers normal. Load Ratio tells you when you’re asking for more than that norm can safely absorb, even if today’s workout felt fine.
This is the lens through which Garmin’s load metrics become genuinely useful. They are not judging your work ethic; they are estimating the biological price you’re paying, and whether that price aligns with sustainable progress rather than short-term bravado.
Understanding Chronic Load: Your Long-Term Fitness Stress Baseline Explained
Chronic Load is the quiet reference point behind every “productive,” “maintaining,” or “strained” message your Garmin delivers. It represents the level of training stress your body has recently adapted to, not what you did yesterday or even last week, but what your physiology now considers normal.
This matters because adaptation is slow. Muscles, connective tissue, cardiovascular capacity, and the nervous system all lag behind motivation, which is why Chronic Load is designed to move gradually and resist short-term spikes in enthusiasm.
What Garmin’s Chronic Load actually measures
Chronic Load is calculated from your accumulated Training Load over a longer rolling window, typically around 28 days. Each activity contributes based on its EPOC-derived physiological cost, meaning intensity and duration matter more than distance or time alone.
Unlike Acute Load, which responds quickly to hard sessions, Chronic Load is intentionally conservative. It reflects what your body has proven it can handle repeatedly, not what you hope it can tolerate next.
Why Chronic Load is your true fitness baseline
Think of Chronic Load as the training stress equivalent of aerobic base. It is the workload your body can absorb while still recovering adequately between sessions.
When Chronic Load rises steadily over weeks, it usually signals successful adaptation. When it stagnates or declines despite high effort, recovery debt, illness, poor sleep, or under-fueling are often limiting adaptation rather than motivation or discipline.
Chronic Load is slow by design, and that’s a feature
Many athletes get frustrated that Chronic Load doesn’t rise quickly after a few big weeks. That frustration is exactly what this metric is designed to protect you from.
Rapid increases in training stress almost always outpace tissue adaptation, especially in tendons and joints. Chronic Load only increases meaningfully when your training has been consistent enough for your body to accept it as a new normal.
How Chronic Load differs from fitness metrics like VO2 max
VO2 max estimates potential aerobic capacity. Chronic Load reflects recent training stress tolerance, which is far more sensitive to recovery quality, life stress, and cumulative fatigue.
You can have a high VO2 max and still carry a low or declining Chronic Load if training has been inconsistent or recovery has been compromised. This is why Chronic Load often explains injury risk better than performance metrics alone.
Interpreting Chronic Load ranges on your Garmin
Garmin establishes a personal optimal Chronic Load range based on your training history. Staying within this range generally means your training stress matches your current capacity to adapt.
When Chronic Load drifts below range, it usually indicates detraining, extended recovery, or reduced consistency. When it climbs above range, it signals accumulated stress that may be productive short-term but risky if sustained without planned recovery.
Why Chronic Load only works with consistent data capture
Because Chronic Load is trend-based, consistency in device use matters more than perfect accuracy. Switching watches, wearing the strap loosely, or mixing chest strap and wrist heart rate randomly can all introduce noise that blunts long-term trends.
Battery life plays a practical role here. Watches like the Forerunner, Fenix, and Enduro lines excel because they can capture weeks of uninterrupted training, sleep, and recovery data without missed sessions quietly eroding Chronic Load accuracy.
Chronic Load and recovery are inseparable
Chronic Load does not increase just because you train hard. It increases when hard training is paired with sufficient recovery to allow adaptation.
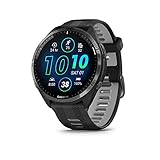
Rank #2
- Premium GPS Running/Triathlon Smartwatch: Advanced GPS running and triathlon smartwatch with integrated music capabilities for enhanced training experience
- Advanced Performance Monitoring: Features include Vo2 Max and training status with adjustments for heat, altitude Acclimation status, training load focus, recovery time, and aerobic and anaerobic training effects
- Contactless Payment Solution: Garmin Pay contactless payment solution (available for supported cards from participating banks) lets you make convenient payments with your watch so you can leave your cash and cards at home
- Full Color Onboard Maps: Full color, onboard maps guide you on your run so you never get lost during your workout
- Safety and Tracking Features: Incident detection (during select activities) which sends your real time location to emergency contacts through your paired compatible smartphone
Poor sleep, high life stress, alcohol, or inadequate fueling can stall Chronic Load even when Acute Load is high. This is why athletes often feel like they are working harder but getting less fit, and the Chronic Load trend usually confirms it.
How Chronic Load sets the context for Load Ratio
Chronic Load is the denominator that gives Load Ratio its meaning. Without a stable Chronic Load baseline, Acute Load has nothing to compare itself against.
If Chronic Load is low, even moderate training weeks can produce a high Load Ratio and elevated injury risk. As Chronic Load rises gradually, the same workouts become safer and more sustainable because they are no longer novel stressors.
Using Chronic Load to guide long-term training decisions
Chronic Load is most useful when reviewed weekly, not daily. Look for slow, stair-step increases over training blocks rather than sharp climbs driven by single weeks.
If Chronic Load plateaus for multiple weeks despite high effort, that is a cue to adjust recovery, nutrition, or stress management before adding more volume or intensity. The goal is not to chase numbers, but to build a baseline your body can actually sustain.
Understanding Acute Load and Load Ratio: Short-Term Stress vs What You’re Conditioned For
Once Chronic Load establishes your long-term training baseline, Acute Load explains what is happening right now. Together, they form the most actionable injury-risk and fatigue-management framework Garmin offers.
Where Chronic Load answers “what am I adapted to?”, Acute Load answers “how much stress did I apply recently?”. Load Ratio is the bridge that connects the two and turns raw numbers into context.
What Garmin means by Acute Load
Acute Load represents the cumulative training load from your most recent short window, typically the last 7 days. It is derived from Garmin’s EPOC-based Training Load calculations, which account for intensity, duration, and heart rate response rather than just mileage or time.
This makes Acute Load highly sensitive to intensity spikes. A few hard interval sessions, a long race simulation, or a weekend of stacked workouts can push Acute Load up rapidly even if total volume seems reasonable.
Because Acute Load responds quickly, it is volatile by design. Day-to-day swings are normal, and trying to keep it perfectly flat usually means you are undertraining.
Why Acute Load alone is not enough
Looking at Acute Load in isolation can be misleading. A value of 900 may be trivial for an athlete with a Chronic Load of 1,200, but dangerously high for someone whose Chronic Load sits at 500.
This is why athletes often say “I didn’t do anything crazy” before getting injured. The workouts may not feel extreme, but relative to what their body is prepared for, the stress is excessive.
Garmin avoids this trap by never presenting Acute Load as a standalone decision metric. Its real value only emerges when compared to Chronic Load.
Load Ratio: the relationship that predicts risk
Load Ratio is simply Acute Load divided by Chronic Load. Conceptually, it answers one critical question: how hard am I training relative to what I am conditioned to handle?
A Load Ratio near 1.0 means your recent training stress closely matches your long-term fitness base. This is where training tends to feel challenging but manageable, and where consistency thrives.
As the ratio climbs, the stress-to-preparedness gap widens. At a certain point, adaptation gives way to excessive fatigue and rising injury risk.
Interpreting Garmin’s Load Ratio ranges
While exact thresholds vary slightly between individuals, Garmin’s guidance aligns well with broader sports science research on acute-to-chronic workload ratios.
A Load Ratio roughly between 0.8 and 1.2 is generally considered the sustainable zone. Training here supports progression while keeping connective tissue, nervous system, and recovery capacity in balance.
Ratios consistently above ~1.3 indicate rapid load accumulation. Short spikes can be tolerated by experienced athletes, but maintaining this range for multiple weeks is where overuse injuries and illness become more likely.
When Load Ratio exceeds ~1.5, Garmin will often flag your training as high risk. At this point, you are asking your body to absorb stress it is not prepared for, regardless of how strong or motivated you feel.
Why low Load Ratio can also stall progress
Avoiding high ratios does not mean staying low forever. A Load Ratio consistently below ~0.7 usually indicates insufficient stimulus to drive adaptation.
This often happens during long recovery phases, unstructured training, or periods of life stress where workouts become shorter and less intense. While useful temporarily, staying here too long leads to stagnant fitness and declining Chronic Load.
Effective training oscillates around the middle. Strategic increases in Acute Load followed by consolidation periods allow Chronic Load to rise without pushing Load Ratio into danger.
How Load Ratio explains “too much, too soon” better than volume
Traditional rules like the 10 percent volume increase fail because they ignore intensity and individual readiness. Load Ratio captures both by anchoring recent stress to your personal training history.
Two athletes can follow the same plan and see very different Load Ratios depending on sleep, prior fitness, and recovery. This is why Garmin’s model adapts to the individual rather than enforcing universal limits.
For athletes returning from illness, injury, or a training break, Load Ratio is especially valuable. It exposes how quickly enthusiasm can outpace tissue readiness, even when workouts feel subjectively easy.
Using Load Ratio in real-world weekly planning
Load Ratio works best when checked at the end of each training week, not after every workout. Look for trends rather than reacting to single-day spikes caused by races or key sessions.
If your ratio jumps sharply one week, the solution is not necessarily complete rest. Often, a few days of low-intensity aerobic work is enough to bring Acute Load down while preserving momentum.
When planning harder blocks, aim for controlled rises in Load Ratio followed by stabilization. The goal is to let Chronic Load catch up before pushing Acute Load again.
Device consistency and why it matters even more for Load Ratio
Because Load Ratio depends on two rolling averages, data gaps distort it quickly. Missed workouts, drained batteries, or switching devices mid-week can artificially deflate Acute Load or Chronic Load.
Garmin watches with strong battery life and stable heart rate tracking, like the Forerunner, Fenix, and Enduro families, reduce this risk in practice. Reliable overnight wear also matters, since recovery metrics influence how load is interpreted within the ecosystem.
For athletes using chest straps, consistency matters more than absolute precision. Pick one setup and stick with it so trends reflect physiology rather than hardware changes.
Load Ratio as a decision-support tool, not a dictator
Load Ratio does not replace coaching judgment, body awareness, or race context. It is a lens, not a rulebook.
Elite athletes may intentionally exceed “safe” ranges during camps or race blocks, but they do so with planned recovery and years of load tolerance behind them. For most recreational and competitive athletes, respecting Load Ratio boundaries is the fastest path to long-term consistency.
Used correctly, Load Ratio protects you from the most common training error: mistaking motivation for readiness.
Ideal, Productive, and Risky Load Ratio Ranges: What the Numbers Really Mean in Practice
Once you accept that Load Ratio is a decision-support tool rather than a strict rule, the next question becomes obvious: what numbers actually matter. Garmin presents Load Ratio as a simple color-coded gauge, but the physiology underneath is anything but simple.
At its core, Load Ratio compares your short-term training stress (Acute Load) to your longer-term training tolerance (Chronic Load). The ranges below are not arbitrary thresholds; they represent how well your body is keeping up with the work you are asking it to do.
Load Ratio below ~0.8: Underloading and missed adaptation
A Load Ratio consistently below about 0.8 usually means Acute Load is well below what your Chronic Load can tolerate. In practical terms, you are training less than your recent fitness base would allow.
This range often appears after extended recovery periods, off-seasons, travel weeks, or injury layoffs. It can also show up unintentionally when athletes rely heavily on short, easy sessions that never challenge cardiovascular or musculoskeletal systems enough to stimulate adaptation.
While this zone is not dangerous, staying here for weeks leads to stagnation. VO2 max plateaus, high-intensity tolerance erodes, and Garmin may begin flagging your training status as “Maintenance” or even “Recovery” despite feeling fresh and motivated.
For athletes returning from illness or injury, this range can be useful temporarily. For healthy athletes chasing performance, it is a sign that load progression has stalled and Acute Load can safely increase.
Load Ratio ~0.8 to 1.3: The productive training sweet spot
This is where most consistent fitness gains occur for well-trained recreational and competitive athletes. Acute Load is challenging the body without overwhelming its ability to recover and adapt.
Within this range, Garmin’s ecosystem typically aligns well: Training Status trends toward “Productive,” HRV remains stable or slightly suppressed with rebounds, and performance metrics like pace at threshold or power at aerobic heart rates gradually improve.
The lower end of this range suits base training and technique-focused phases. The upper end is common during build phases, where structured intensity is layered onto an established aerobic foundation.
Importantly, this range is not static. As Chronic Load rises over months, the same workouts produce a lower Load Ratio, signaling increased durability. This is one of the clearest signs that training is working, even before race results confirm it.
Load Ratio ~1.3 to 1.5: High strain, limited margin for error
A Load Ratio in this band indicates that Acute Load is significantly outpacing what your recent training history has prepared you for. Adaptation is still possible here, but the recovery cost is high.
Short-term exposure can be appropriate during training camps, race-specific blocks, or breakthrough weeks. However, it requires deliberate recovery planning and close attention to secondary signals like sleep quality, resting heart rate, and HRV trends.
In Garmin Connect, this range often coincides with “Strained” or unstable Training Status, even if workouts are being completed successfully. The body may be coping, but it is no longer buffering stress efficiently.
For most athletes, lingering here longer than 7–14 days increases injury risk, particularly connective tissue issues that lag behind cardiovascular fitness. This is where motivation can mask accumulating fatigue.
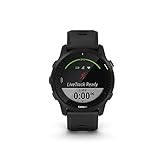
Rank #3

- LTE connectivity (must have an active subscription plan and connectivity to a Category M1 LTE network) enables phone-free safety and tracking features, including LiveTrack and Assistance Plus, a feature that connects you to the Garmin IERCC, a professional 24/7 emergency monitoring and response center (Assistance Plus is not available in all markets where Category M1 LTE network connectivity is available), plus you can receive messages from fans during your race
- o Battery life: up to 2 weeks of battery life in smartwatch mode, 12 hours in GPS mode with music and 7 hours in GPS mode with music and LTE LiveTrack
- Bring music for every mile by downloading from music services (may require premium subscription with a third-party music provider) such as Amazon Music, Deezer, Spotify and more to easily store and play up to 1,000 songs from your wrist when paired with compatible headphones
- Train smarter with performance measurements adjusted for heat and altitude, track recovery time, predict your race finish time, monitor heart rate (this is not a medical device) underwater and much more
- Leave your cash and cards at home; Garmin Pay contactless payments (with a supported country, payment network and issuing bank information) let you pay for purchases on the go
Load Ratio above ~1.5: Overreaching territory and red flags
Once Load Ratio exceeds roughly 1.5, Acute Load has surged far beyond Chronic Load. Garmin is effectively warning that training stress has outrun structural and metabolic readiness.
This zone commonly appears after race weekends, sudden mileage jumps, aggressive intensity stacking, or life-stress collisions where recovery capacity drops without a reduction in training. The danger is not a single hard week, but the failure to let Chronic Load catch up afterward.
Physiologically, this is where HRV suppression becomes more pronounced, resting heart rate may drift upward, and sleep metrics often deteriorate. Performance can paradoxically feel fine for a short period before crashing.
For non-elite athletes, repeated entries into this range are strongly associated with overuse injuries and prolonged plateaus. The correct response is rarely total rest, but rather a rapid reduction in intensity and volume to allow Acute Load to fall back toward sustainable levels.
Why the same Load Ratio feels different for different athletes
Load Ratio is individualized, not universal. Two athletes with the same ratio may experience vastly different recovery outcomes depending on training age, biomechanics, sleep consistency, nutrition, and life stress.
Endurance-trained athletes with years of progressive loading often tolerate brief excursions into higher ratios better than newer athletes. Strength-focused athletes crossing into endurance-heavy phases may find even moderate ratios disproportionately fatiguing.
This is why Load Ratio must be interpreted alongside Chronic Load trends. A ratio of 1.2 with a rising Chronic Load is far more robust than the same ratio with a flat or declining base.
Using ranges dynamically rather than chasing a “perfect” number
The most common mistake is treating Load Ratio like a target to hold steady. In reality, effective training cycles oscillate deliberately through these ranges.
Productive blocks involve controlled rises into the upper end of the sweet spot, followed by consolidation weeks where the ratio drops as Chronic Load absorbs the work. Risky ranges are not forbidden, but they demand an exit plan.
Garmin’s value lies in making these patterns visible. When you understand what each range represents physiologically, Load Ratio stops being a color on a screen and becomes a tool for timing stress, recovery, and long-term progression with far greater precision.
How Chronic Load, Load Ratio, HRV Status, and Training Readiness Work Together (and When They Disagree)
Once you stop treating Chronic Load and Load Ratio as isolated numbers, Garmin’s ecosystem starts to behave like a coherent decision-support system. Each metric reflects a different layer of the stress–recovery equation, and understanding their hierarchy is what separates productive overload from slow-burn overtraining.
Chronic Load tells you what you are prepared for. Load Ratio tells you how aggressively you are testing that preparation. HRV Status and Training Readiness tell you how well your body is coping with that stress right now.
When all four align, training decisions are straightforward. When they disagree, the signal is often more important than the number you want to see.
The role each metric actually plays
Chronic Load is your long-term training capacity, built over weeks to months. It changes slowly and reflects durable physiological adaptations like mitochondrial density, connective tissue tolerance, and neuromuscular resilience.
Load Ratio is a short-term stress gauge. It compares your recent Acute Load against that Chronic Load base, making it highly sensitive to sudden spikes in volume, intensity, or both.
HRV Status reflects autonomic nervous system balance. It responds quickly to cumulative fatigue, poor sleep, psychological stress, illness, and under-fueling, often before performance drops.
Training Readiness is a synthesis metric. Garmin blends HRV trends, sleep quality, recent load, recovery time, and stress data into a single score meant to guide day-to-day decisions rather than long-term planning.
Think of Chronic Load as the foundation, Load Ratio as the stress lever, HRV as the internal alarm system, and Training Readiness as the dashboard summary.
When everything agrees: the ideal scenario
The cleanest green-light scenario looks like this: Chronic Load is stable or rising, Load Ratio sits in the productive range, HRV Status is balanced, and Training Readiness is moderate to high.
This usually occurs mid-block, after a few weeks of consistent training without abrupt spikes. The body is absorbing the work, autonomic balance is intact, and fatigue is present but controlled.
In this state, Garmin’s metrics are essentially confirming what experienced athletes already feel: training is hard, but it feels purposeful. This is where progression, not restraint, is usually the correct call.
High Load Ratio with stable HRV: short-term overload, not panic
One common point of confusion is seeing a Load Ratio drift into the high or very high range while HRV remains normal. This often happens early in a build phase or during a planned overload week.
Physiologically, this indicates that external stress has increased, but internal systems have not yet been overwhelmed. Well-trained athletes with strong Chronic Loads can tolerate this briefly without negative consequences.
The key variable here is time. If HRV remains stable for several days and Training Readiness does not collapse, this can be a successful overload stimulus. If HRV begins to trend downward after several days, that is your cue to exit the block.
Normal Load Ratio with suppressed HRV: hidden fatigue
This is one of the most important disagreement patterns to recognize. Load Ratio may look perfectly reasonable, yet HRV Status shifts to unbalanced or low.
This usually reflects non-training stress that Chronic Load and Load Ratio cannot see. Poor sleep, work stress, travel, illness onset, caloric deficit, or dehydration are common culprits.
In this scenario, increasing training load because the ratio “allows it” is a mistake. The correct response is to maintain or slightly reduce training stress until HRV stabilizes, even if Load Ratio suggests room to push.
High Training Readiness with rising Load Ratio: why context matters
Garmin users are often surprised to see high Training Readiness scores alongside an aggressive Load Ratio. This typically occurs after a strong recovery night following several hard sessions.
Training Readiness is acutely responsive. It tells you how prepared you are today, not whether your current trajectory is sustainable.
Using this signal wisely means asking a different question: is today the right day for intensity, or should today consolidate the work already done? High readiness can justify quality, but it does not erase cumulative load risk.
Low Training Readiness despite “good” numbers elsewhere
Another frequent disagreement is a low Training Readiness score when Chronic Load and Load Ratio appear well managed. This often frustrates disciplined athletes who feel their training has been textbook.
In most cases, the limiting factor is sleep or HRV. Garmin weights these heavily because performance without recovery is short-lived.
Ignoring this signal repeatedly tends to convert manageable fatigue into chronic suppression. Using it strategically, such as swapping intensity for low-aerobic volume, preserves long-term momentum without forcing complete rest.
Why HRV often deserves the tie-breaker role
When metrics conflict, HRV Status should usually carry the most weight. It reflects the body’s integrated response to all stressors, not just training load.
Chronic Load and Load Ratio describe what you did. HRV describes how your body handled it.
Athletes who consistently respect HRV trends, even when other metrics look permissive, experience fewer injuries, fewer plateaus, and more predictable peaks. This is especially true for masters athletes and those balancing high life stress.
Putting it together in real-world decisions
If Chronic Load is rising, Load Ratio is elevated, HRV is stable, and Training Readiness is acceptable, proceed with intent but plan recovery within days, not weeks.
If Load Ratio is moderate but HRV is suppressed and Training Readiness is low, protect recovery aggressively. Reduce intensity first, not necessarily frequency.
If Chronic Load is flat or declining while Load Ratio stays high, the system is signaling fragility. This is where overuse injuries often emerge, even if workouts still feel strong.
Garmin’s real power is not prediction, but pattern recognition. When you stop asking which single metric is “right” and instead read how they interact, overtraining stops being a surprise and becomes something you can see coming days or even weeks in advance.
Real-World Training Decisions: When to Push, Maintain, or Back Off Using Load Ratio
Once you understand how Chronic Load sets context and Load Ratio flags change, the next step is using those numbers to make confident daily decisions. This is where Garmin stops being descriptive and becomes prescriptive, provided you read the signals in combination rather than isolation.
Load Ratio is most powerful when treated as a decision filter layered on top of your plan, not a replacement for it. The question is not “Is my ratio good?” but “Given my ratio and recovery signals, what kind of training stress can I absorb today?”
When Load Ratio is low: why “fresh” doesn’t always mean push
A Load Ratio below roughly 0.8 usually means your recent training stress is well below what your body has been conditioned for. This often appears after a recovery week, illness, travel, or an unplanned break.
In this state, athletes often feel sharp and eager, and Garmin may show high Training Readiness and positive HRV. This is a green light to reintroduce structure, but not a license to stack intensity back-to-back.
The smartest move here is progressive reloading. Resume intensity, but cap volume increases to avoid large single-day spikes that can overshoot your Chronic Load faster than your connective tissue adapts.
For runners, this might mean one quality session plus easy aerobic volume, not two hard workouts in the first three days back. For cyclists, it’s a structured interval day paired with endurance riding rather than consecutive threshold sessions.
The productive zone: maintaining Load Ratio between roughly 0.8 and 1.2
This is where most sustainable performance gains happen. A Load Ratio in this range indicates that your recent training matches your established tolerance, and Garmin’s algorithms generally consider this “optimal” load management.
If HRV is stable and sleep metrics are solid, this is the zone where you can maintain intensity frequency or selectively increase one variable at a time. Volume, intensity, or density can move, but not all three simultaneously.
Athletes often underestimate how effective this range is because it doesn’t feel extreme. Yet this is where VO2 max trends upward, race pace stabilizes, and durability improves without accumulating silent fatigue.
Rank #4
- Brilliant AMOLED touchscreen display with traditional button controls and lightweight titanium bezel
- Battery life: up to 23 days of battery life in smartwatch mode, up to 31 hours in GPS mode
- Confidently run any route using full-color, built-in maps and multi-band GPS
- Training readiness score is based on sleep quality, recovery, training load and HRV status to determine if you’re primed to go hard and reap the rewards (data presented is intended to be a close estimation of metrics tracked)
- Plan race strategy with personalized daily suggested workouts based on the race and course that you input into the Garmin Connect app and then view the race widget on your watch; daily suggested workouts adapt after every run to match performance and recovery
Staying here for weeks is not stagnation. It is consolidation, and it’s what allows later overload phases to work instead of backfiring.
Strategic pushing: using short-term Load Ratio elevation intentionally
A Load Ratio between roughly 1.2 and 1.5 is not inherently bad. This is the range where overload blocks live, and where meaningful adaptations are often triggered when timed correctly.
The key distinction is intent and duration. A brief rise in Load Ratio during a planned build, supported by stable HRV and adequate sleep, is very different from an unplanned spike caused by stacking hard sessions impulsively.
Garmin becomes especially useful here because it updates Acute Load daily. You can see in near real time whether your overload is controlled or accelerating beyond plan.
When pushing, plan the exit before the entry. If you allow Load Ratio to climb, schedule a downshift within 5 to 10 days so Chronic Load can catch up and the ratio normalizes.
When Load Ratio is high and Chronic Load is flat: the danger zone
One of the most overlooked red flags is a high Load Ratio paired with stagnant or declining Chronic Load. This combination means recent stress is high, but long-term capacity is not improving.
This often happens when intensity replaces volume rather than complements it. Short, hard workouts can inflate Acute Load without meaningfully raising Chronic Load, especially in time-crunched athletes.
Garmin may still show decent performance metrics, but injury risk rises sharply here. Tendons, fascia, and joints adapt slower than cardiovascular systems, and this mismatch is where overuse injuries appear.
The correct response is not necessarily rest, but rebalancing. Reduce intensity frequency and rebuild low-aerobic volume to raise Chronic Load more safely.
Clear back-off signals: when Load Ratio exceeds recovery capacity
Once Load Ratio pushes beyond roughly 1.5, especially if HRV is suppressed or Training Readiness drops, you are no longer in productive overload. You are borrowing adaptation from the future.
At this point, Garmin is signaling that your Acute Load has outpaced your recovery systems. Continuing to push here rarely leads to breakthroughs and often leads to forced downtime later.
Backing off does not mean stopping. The most effective response is intensity reduction while maintaining movement through easy aerobic work, mobility, and technical sessions.
This approach allows Acute Load to fall without collapsing Chronic Load, preserving fitness while restoring balance.
Day-to-day decision-making: how to adjust without derailing the plan
On any given morning, use Load Ratio as a boundary rather than a command. If today’s planned session would push your ratio higher while HRV is trending down, adjust the session before it adjusts you.
This might mean shortening intervals, lowering power targets, or converting a hard day into aerobic volume. These changes feel small but compound into consistency over months.
Garmin’s value here is immediacy. Because Load Ratio responds quickly, it allows you to course-correct within days instead of discovering the problem weeks later through fatigue or injury.
The athletes who get the most from this metric are not those who chase perfect numbers, but those who use it to protect momentum. They push when the system is prepared, maintain when it’s absorbing, and back off before warning signs become setbacks.
Sport-Specific Application: Runners, Cyclists, Triathletes, and Cross-Training Athletes
Load Ratio and Chronic Load only become truly useful when they are filtered through the mechanical and metabolic demands of your sport. The same number can signal productive overload for one athlete and a fast track to injury for another.
What follows is how to interpret these metrics through a sport-specific lens, using Garmin’s ecosystem as a decision-making tool rather than a scoreboard.
Runners: managing impact before intensity becomes a liability
For runners, Load Ratio tends to rise quickly because Garmin’s Training Load heavily weights intensity and impact-driven stress. A small increase in interval volume or hill work can spike Acute Load far more than expected, especially if running frequency is high.
Most durable runners sit comfortably with a Load Ratio between roughly 0.9 and 1.3 during base and early build phases. Once the ratio pushes past 1.4 for more than a few days, injury risk rises even if VO2 max and race predictions still look strong.
The key mistake runners make is using “easy pace” as justification to ignore Load Ratio. Easy miles still accumulate musculoskeletal stress, and Garmin captures this through sustained aerobic load rather than pace alone.
When Load Ratio climbs too fast, the fix is rarely total rest. Reduce intensity density first by removing one hard session or converting it into aerobic strides, then maintain volume to protect Chronic Load.
Watch hardware matters here. Lighter Garmin models like the Forerunner series reduce wrist bounce and improve HR accuracy on long runs, which directly affects Training Load calculation and keeps Load Ratio from being distorted by sensor noise.
Cyclists: volume tolerance is high, but intensity debt adds up
Cyclists can sustain higher Chronic Load than most athletes because cycling minimizes eccentric muscle damage. Garmin often shows higher absolute load numbers for cyclists without the same injury implications seen in runners.
The danger zone for cyclists is not total load, but how intensity is stacked. Back-to-back threshold or VO2 sessions can drive Load Ratio above 1.5 while legs still feel deceptively fine.
Garmin’s Load Ratio is especially useful during indoor training blocks, where ERG mode removes natural variability. If Acute Load keeps climbing while HRV trends down, the system is signaling autonomic fatigue even if power numbers remain stable.
Smart trainers paired with Garmin Edge devices feed highly accurate power data, making Training Load more precise than heart rate alone. This accuracy cuts both ways, exposing overreaching earlier than perceived fatigue would.
When Load Ratio stays elevated, shift one hard ride into low-cadence aerobic work or extend endurance rides while pulling intensity back. Chronic Load will stabilize without digging a deeper recovery hole.
Triathletes: balancing three stress curves instead of one
Triathletes often misread Load Ratio because Garmin aggregates stress across swim, bike, and run into a single number. The ratio may look reasonable while one discipline quietly accumulates excessive strain.
Running usually becomes the limiting factor, even when bike and swim loads dominate total volume. A Load Ratio of 1.2 can still be risky if most of that Acute Load comes from run intensity layered on top of bike fatigue.
The most effective triathletes use discipline-specific rotation to manage Load Ratio. If run load is peaking, bike intensity becomes aerobic support rather than competition for recovery resources.
Garmin multisport watches handle this well, but only if all sessions are recorded consistently. Missed swims or unrecorded strength sessions artificially suppress Chronic Load and create misleading Load Ratio spikes later.
Battery life and comfort matter more here than aesthetics. Devices like the Fenix and Enduro lines allow continuous tracking through long training days without compromising data continuity, which is critical for accurate load trends.
Cross-training and mixed-modality athletes: interpreting non-linear stress
CrossFit and hybrid athletes challenge Garmin’s load model because strength, metabolic conditioning, and skill work stress the body differently than endurance training. Acute Load often spikes disproportionately after short, intense sessions.
Garmin’s Training Load responds primarily to cardiovascular strain, not connective tissue or neural fatigue. This means Load Ratio may underrepresent recovery cost when heavy lifting or plyometrics dominate the week.
The smartest application here is trend-based rather than session-based. If Load Ratio rises steadily while HRV drops and Training Readiness remains suppressed, recovery debt is accumulating even if workouts feel manageable.
Use Chronic Load as a ceiling rather than a target. Maintain it through aerobic work, mobility, and low-impact conditioning while spacing high-intensity or high-load strength sessions farther apart.
Durability and strap comfort matter more than weight for these athletes. Reinforced cases, secure bands, and sweat-resistant materials improve compliance, which ultimately improves data reliability.
Using sport context to prevent false positives and false confidence
Garmin’s Load Ratio is not wrong when it feels conservative, and it is not permissive when it feels forgiving. It reflects how your recent training stress compares to what your body has been prepared to absorb.
Sport-specific interpretation prevents two common errors: runners pushing through rising ratios because fitness looks good, and cyclists ignoring autonomic fatigue because legs still turn over. The metric works best when paired with an understanding of how your sport breaks down tissue and recovers it.
When in doubt, let Chronic Load rise slowly and let Load Ratio dictate patience. Performance gains are rarely lost by backing off early, but they are often erased by ignoring the warning signs your watch is already showing you.
Common Mistakes Garmin Users Make with Load Metrics (and How to Avoid False Overtraining Flags)
As Load Ratio and Chronic Load become central to Garmin’s training guidance, most overtraining alerts are not caused by poor fitness, but by poor interpretation. The watch is usually responding correctly to the data it sees, even when the conclusion feels wrong.
Understanding where athletes misapply these metrics is the difference between using Garmin as a performance ally and fighting constant false warnings.
Treating Load Ratio as a daily decision tool instead of a trend
One of the most common mistakes is reacting to a single-day spike in Load Ratio. A hard workout after a rest day can briefly push Load Ratio above optimal without indicating meaningful risk.
Load Ratio is designed to smooth stress across several days, not to judge individual sessions. Short-term excursions above 1.3 are normal during structured training blocks, especially when intensity is intentionally clustered.
The fix is simple: evaluate Load Ratio across 5–10 days, not 24 hours. If it remains elevated while HRV trends downward or Training Readiness stays suppressed, then intervention is warranted.
Chasing Chronic Load numbers instead of respecting capacity
Many athletes see Chronic Load as a score to grow indefinitely, similar to VO2 max. This mindset leads to forced volume increases that outpace tissue adaptation.
Chronic Load reflects what you have consistently tolerated, not what you should be doing next. When athletes artificially inflate it with junk miles or excessive intensity, Load Ratio eventually spikes and recovery collapses.
💰 Best Value
- LTE connectivity (must have an active subscription plan and connectivity to a Category M1 LTE network) enables phone-free safety and tracking features, including LiveTrack and Assistance Plus, a feature that connects you to the Garmin IERCC, a professional 24/7 emergency monitoring and response center (Assistance Plus is not available in all markets where Category M1 LTE network connectivity is available), plus you can receive messages from fans during your race
- o Battery life: up to 2 weeks of battery life in smartwatch mode, 12 hours in GPS mode with music and 7 hours in GPS mode with music and LTE LiveTrack
- Bring music for every mile by downloading from music services (may require premium subscription with a third-party music provider) such as Amazon Music, Deezer, Spotify and more to easily store and play up to 1,000 songs from your wrist when paired with compatible headphones
- Train smarter with performance measurements adjusted for heat and altitude, track recovery time, predict your race finish time, monitor heart rate (this is not a medical device) underwater and much more
- Leave your cash and cards at home; Garmin Pay contactless payments (with a supported country, payment network and issuing bank information) let you pay for purchases on the go
Use Chronic Load as a stabilizing anchor. Productive training maintains or gradually nudges this value upward over weeks, not days, with clear recovery periods built in.
Ignoring HRV when Load metrics feel “off”
Garmin’s Load metrics estimate external stress, while HRV reflects internal response. When these two disagree, users often trust Load alone.
This is a mistake. A stable Load Ratio paired with declining HRV often indicates accumulated autonomic fatigue that hasn’t yet surfaced in performance or perceived exertion.
The correct response is not panic, but adjustment. Reduce intensity density, improve sleep consistency, and allow HRV to recover before adding further load, even if Load Ratio still looks acceptable.
Misinterpreting rest days as “wasted” training time
Rest days often cause Acute Load to drop faster than Chronic Load, briefly lowering Load Ratio into what looks like an unproductive range. Many athletes respond by adding unnecessary sessions.
This creates artificial oscillations that confuse the model and stress the athlete. Garmin expects occasional Load Ratio dips as part of sustainable training.
A true recovery day protects Chronic Load long-term by preserving consistency. If Load Ratio rebounds naturally within 48–72 hours, the system is working as intended.
Letting strength training distort Load interpretation
Heavy lifting, plyometrics, and high-force work generate significant fatigue with limited cardiovascular signal. Garmin underestimates this cost, making Load Ratio appear safer than reality.
Athletes then stack intense strength and endurance sessions under the assumption that Load is controlled. The result is connective tissue overload rather than metabolic overtraining.
The solution is conservative accounting. After heavy strength days, mentally add “phantom load” when planning subsequent sessions and avoid interpreting low Load Ratio as full recovery.
Assuming higher Load always equals better preparedness
Some users associate higher Acute Load with feeling “fit” and interpret lower values as detraining. This leads to chronic overstimulation and suppressed recovery signals.
Performance readiness is not determined by how much load you are carrying, but by how well you are absorbing it. Garmin’s metrics reward absorption, not accumulation.
Watch for stability. The most resilient athletes maintain moderate Chronic Load with narrow Load Ratio fluctuations, not dramatic peaks and crashes.
Overreacting to software updates or device changes
Switching watches, changing heart rate straps, or firmware updates can recalibrate Load calculations. Users often mistake these shifts for physiological changes.
A new optical sensor, tighter strap fit, or different wrist placement can alter heart rate capture enough to move Load metrics noticeably.
When this happens, give the system 2–3 weeks to relearn before making training decisions. Consistency in wear, strap comfort, and sensor placement improves long-term data reliability.
Forgetting that Load metrics do not see everything
Travel stress, illness, heat exposure, poor sleep, and life stress all reduce recovery capacity without directly affecting training load. Garmin can only partially account for these factors.
Athletes who ignore context often push through “green” Load metrics during red-life weeks. This is where false confidence causes real overtraining.
Use Load Ratio and Chronic Load as guardrails, not blindfolds. When life stress rises, treat your current Chronic Load as temporarily higher than the watch suggests and adjust accordingly.
By avoiding these common missteps, Garmin’s Load metrics shift from being restrictive to being predictive. They stop flagging overtraining after the damage is done and start helping you prevent it while progress is still intact.
Advanced Tips: Using Load Trends Across Training Blocks, Races, and Recovery Weeks
Once you stop reacting to daily swings and start watching patterns, Chronic Load and Load Ratio become planning tools rather than warning lights. This is where Garmin’s metrics shift from descriptive to strategic.
The goal at this stage is not to keep numbers “perfect,” but to guide how stress rises, stabilizes, and falls across weeks and months without breaking adaptation.
Reading Load Trends Across a Full Training Block
In a well-structured block, Chronic Load should climb gradually over 3–6 weeks, not jump suddenly. Think of it as a slow tide coming in rather than waves crashing on the shore.
A sustainable build typically shows a rising Chronic Load with Load Ratio spending most of its time between roughly 0.9 and 1.2. Brief excursions above that range are normal during key workouts, but they should resolve within a few days.
If Load Ratio stays elevated for more than 7–10 days while Chronic Load plateaus, you are no longer building fitness. You are accumulating fatigue without adding capacity.
Using Load Ratio to Control Intensity Distribution
Many athletes overload intensity without realizing it, especially during build phases. Garmin’s Load Ratio often exposes this before soreness or fatigue does.
If Load Ratio spikes repeatedly after short, hard sessions despite modest volume, it is a sign that intensity density is too high. The solution is usually fewer hard days, not shorter workouts.
Athletes who distribute stress better see smoother Load Ratio curves even as Chronic Load rises. This stability is strongly associated with better race durability and fewer forced down weeks.
Managing Load During Race Weeks and Peak Events
Race weeks are one of the most misunderstood periods in Garmin data. A taper will often lower Acute Load and briefly drop Load Ratio below “optimal,” which many users misinterpret as lost fitness.
This dip is expected and desirable. Chronic Load reflects what you have already built, not what you are losing in a few easy days.
For most endurance events, the best race-week pattern is stable Chronic Load with a Load Ratio drifting toward 0.8–0.9. This indicates reduced fatigue while preserving readiness.
Interpreting Post-Race Load Without Panic
After a race, Acute Load often spikes dramatically, especially for long events or hard efforts. Load Ratio may exceed 1.5 even if you took rest days beforehand.
This is not overtraining by default. It is a single, concentrated stressor layered onto a high Chronic Load base.
What matters is how quickly Load Ratio normalizes. If it returns toward baseline within 7–10 days, recovery is proceeding well. If it stays elevated despite reduced training, that is your signal to extend recovery.
Structuring Recovery Weeks That Actually Work
A recovery week is not about driving Load Ratio as low as possible. It is about allowing Acute Load to fall while Chronic Load declines only slightly.
Well-executed recovery weeks show Load Ratio dropping into the 0.7–0.9 range while Chronic Load remains relatively stable. This preserves adaptations while restoring freshness.
If Chronic Load collapses sharply during recovery weeks, you are likely under-training during those periods. If Load Ratio never drops, recovery is incomplete no matter how easy the sessions feel.
Using Long-Term Load History to Spot Burnout Early
Garmin’s 12–16 week Load history is where early burnout signals live. Look for repeated cycles where Chronic Load rises, Load Ratio spikes, and then both crash.
This pattern often precedes injury, illness, or mental fatigue. It reflects aggressive builds followed by forced rest rather than planned recovery.
Athletes who stay healthy show smoother Chronic Load arcs over months, with Load Ratio oscillating narrowly around baseline rather than swinging wildly.
Adjusting Expectations During Life Stress and Travel
During periods of poor sleep, travel, or high work stress, your effective Load Ratio is higher than Garmin reports. The physiological cost of each session increases even if training load does not.
In these weeks, aim to keep Load Ratio at the lower end of your normal range and avoid pushing Chronic Load upward. Holding steady is a win when recovery capacity is reduced.
This is especially relevant for athletes relying on wrist-based heart rate, where dehydration, heat, and disrupted routines can subtly skew load calculations.
Aligning Load Metrics With Performance Outcomes
The most useful validation of Garmin’s Load metrics is performance consistency. When races, key workouts, and long sessions feel repeatable rather than heroic, your Load trends are likely appropriate.
Athletes who chase numbers often feel great one week and flat the next. Athletes who respect trends feel predictably strong when it counts.
Over time, you should be able to look at a successful race or season and recognize the Load signature that preceded it. That becomes your personal blueprint.
Final Takeaway: Train the Trend, Not the Day
Chronic Load and Load Ratio are not about micromanaging workouts. They are about shaping stress over time so adaptation stays ahead of fatigue.
When you use these metrics across training blocks, races, and recovery weeks, they become guardrails that protect progress rather than limits that hold you back.
Master the trend, respect recovery, and Garmin’s Load data stops being something you react to and starts becoming something you use to train with confidence.